Box Office Revenue
Data Visualization
Introduction
In this project I developed a set of data visualizations based on datasets I sourced and cleaned.
The visualizations use JavaScript, the D3 library specifically, in Observable which is a push system for JavaScript. We developed our code here for ease of sharing between teammates and our course instructor.
Observable Notebook
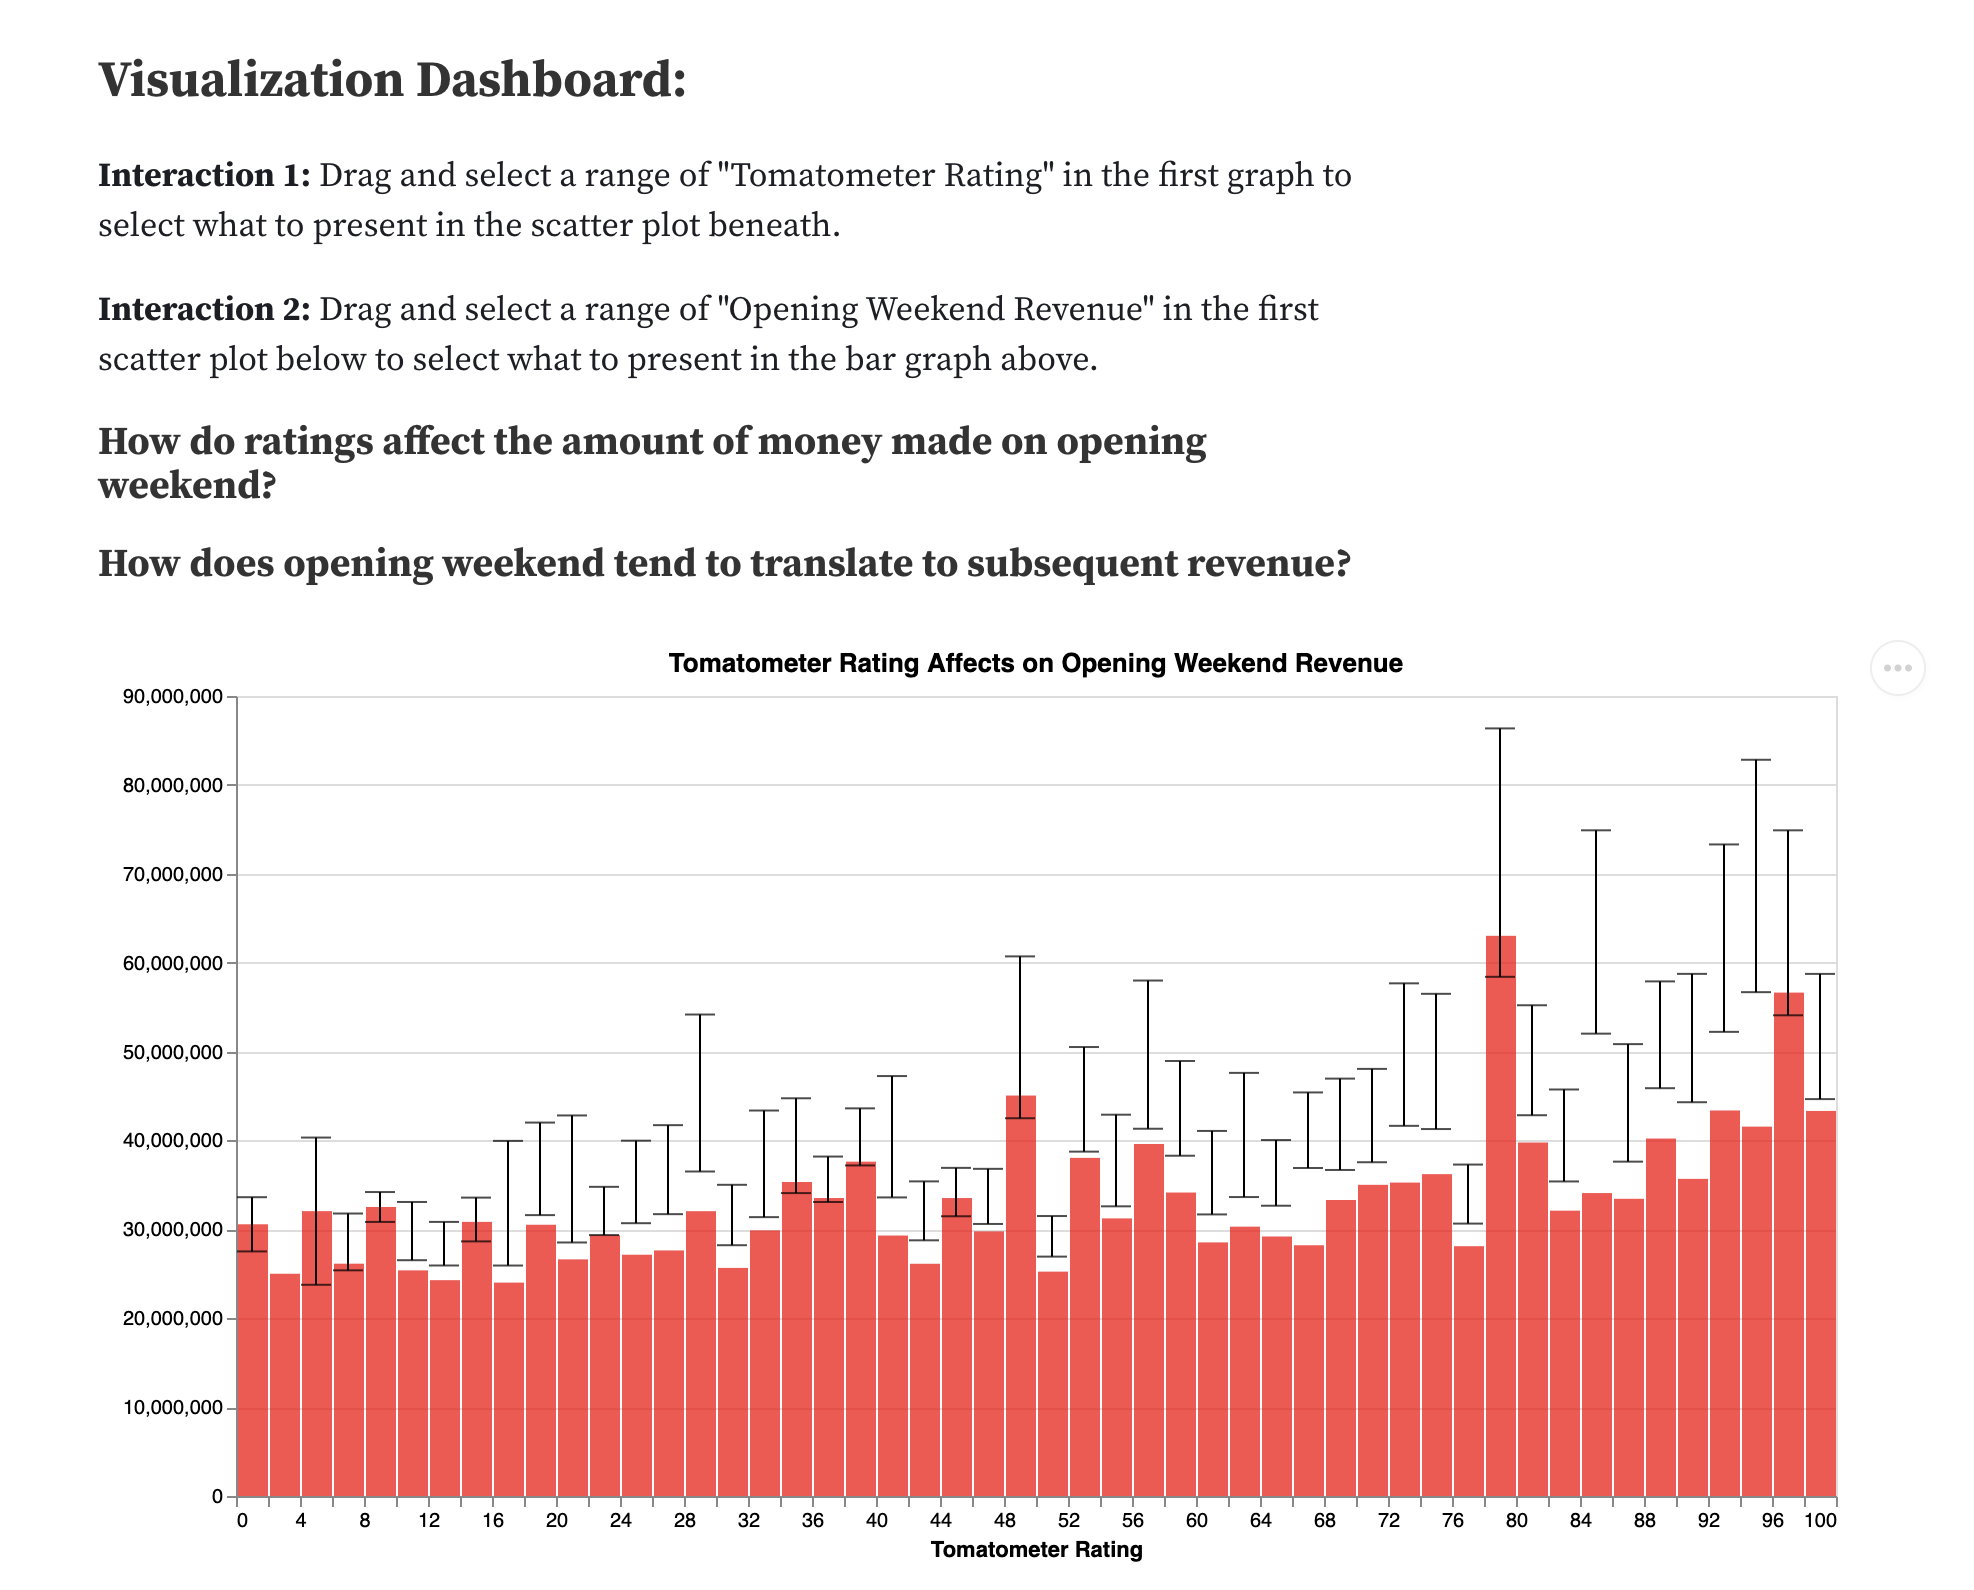
Here’s our complete final project. Please feel free to take a look and try out the interactions.

Role
I partnered up with my fellow classmate Johnny and together brainstormed areas of interests.
We wanted a dataset that lended itself to something more visual like a map. Ideally we wanted a dataset with geo-data as well, but we found that movie revenue was multifaceted and interesting enough to let go of our desire to plot geo-data.
My role in the group was to develop questions and lay out our project alongside Johnny. Both Johnny and I coded parts of the overall project, but the majority of the project was actually coded by myself as I was more focused on learning and teasing out the methods for using the D3 library. Johnny would user test, give feedback as well as link me to interesting and relevant implementations which I would take a look at and apply to our project.
Project Outcomes
Our project ended up doing really well and our professor, Christopher Shaw, requested permission to show it to future classes.
While a geo-data based dataset to explore and visualize, we still successfully answered our research questions and represented the data in an effective and engaging way. Each visualization answered distinct research questions using different parts of the D3 library. It was a really good learning experience and quite enjoyable playing with the library.